MEASURING SUCCESS
The Association of Leading Visitor Attractions (ALVA) has supported the industry for 20+ years by carrying out two benchmarking surveys illustrating how to learn from best-in-class visitor experiences to create a great attraction.
The Financial Survey benchmarks income, productivity and profitability, whereas the Visitor Survey benchmarks the on-site visitor experience. These two surveys allow attractions to track their performance over time, make comparisons with their peers and identify best-practice and inspirational sites.
“In the last four years ALVA’s membership has increased by a third, we now organise five times more events than before – nearly one a fortnight – and the diversity of our membership has increased. Key to this success is the importance of our benchmarking services.
“We have more organisations and sites participating than ever before, sharing with and learning from each other to the benefit of not just themselves but, ultimately, the customer. Knowing what success looks like and having the ability to measure it and learn from the data it provides is key to continual improvement and at ALVA we put that at the heart of everything we do,” explains ALVA’s director, Bernard Donoghue.
BENCHMARKING FINANCES
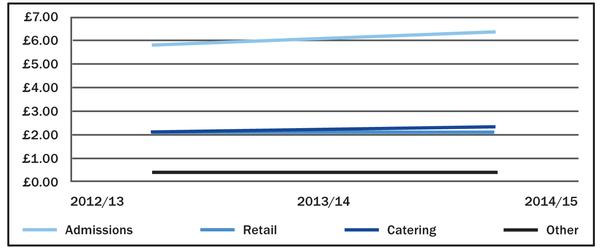
Despite a tough competitive environment, with increasing competition from new visitor attractions, other forms of out-of-home leisure and in-home entertainment, the participants of the Financial Survey report, on average, continued growth in their attendance and spend levels. Average attendance in 2014/15 for the constant sample was just under 800,000; an increase of three per cent per annum compared with the previous two years. Total visitor spend also grew by an average of three per cent per annum over the same period, with admissions spend the main driver of growth (see Figure 1).
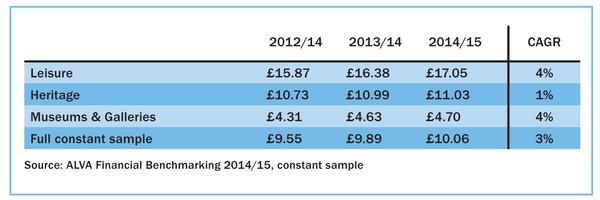
The survey results are also divided into three main sectors to allow participants to benchmark their performance against the most comparable of their peers: heritage, museums and galleries, and leisure. As shown in Figure 2, performance can vary considerably by sector. A key factor behind the range of visitor spends achieved is the admission price. Many museums and galleries in the sample have free admission to their main collection and so their spend levels are driven by temporary exhibitions, retail and catering, and other visitor activities.
As a general rule, leisure sites often have longer lengths of stay compared with heritage sites and museums and galleries, allowing them to charge higher prices and providing greater opportunities for retail – and, in particular, catering spend – during a visit.
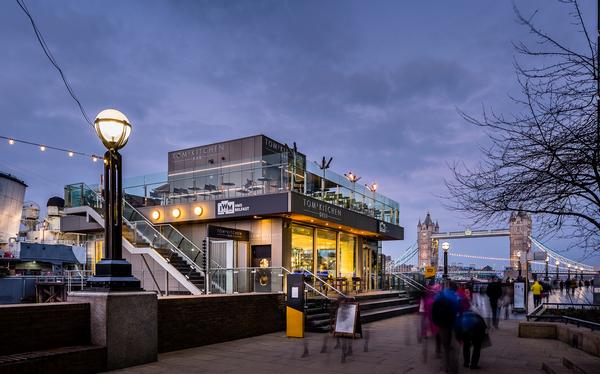
The Financial Survey has helped attractions to improve their performance by identifying such opportunities to increase the scale of their retail and/or catering offer, in addition to providing evidence to support price increases and helping to inform internal decisions. ALVA member HMS Belfast on London’s River Thames has taken these opportunities on board with this year’s on-site launch of celebrity chef Tom’s Kitchen cafe and bar.
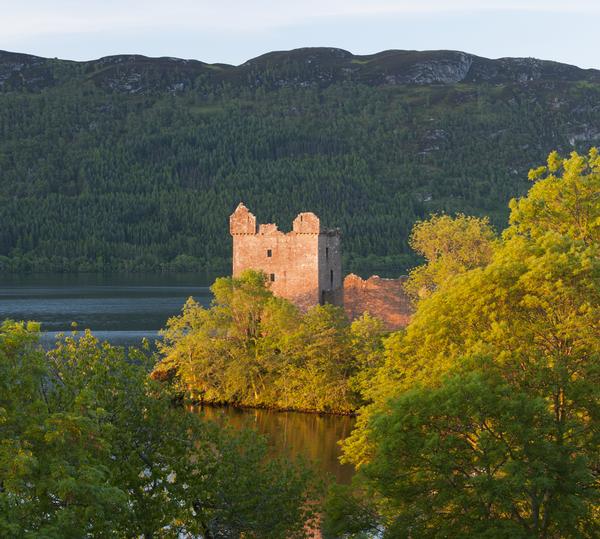
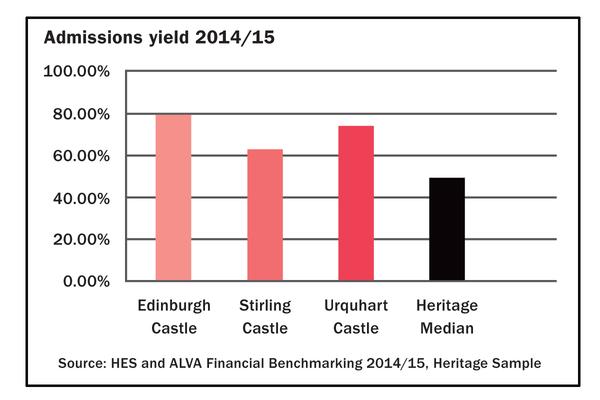
Emma Martin, commercial analyst at Historic Environment Scotland (HES), spoke at the 2015 ALVA Benchmarking Seminar about how the surveys’ are used by HES to monitor performance of their three main sites: Edinburgh Castle, Stirling Castle and Urquhart Castle.
HES compares their sites’ performance with the ALVA Heritage Sample median, identifying opportunities for growth and incidences of strong performance, like the relatively high admissions yields (see Figure 3) to motivate staff and managers. Data on retail and catering performance have been particularly relevant in preparing the business case for their trading arm. Staffing benchmarks have also supported their case for increasing staff numbers at Edinburgh Castle.
Stephen Duncan, director of commercial and tourism at HES, said: “It’s great to see Edinburgh Castle at the top of the table in Scotland after another record breaking year for the castle. We’ve seen particular growth in online and travel trade at the castle in 2015, and following a refresh of the castle website towards the end of the year. I’m sure this will continue. Both Stirling Castle and Urquhart Castle have also had record years, with each seeing a rise in visitors signing up for membership – showing that Scotland’s historic visitor attractions continue to be a vital component of the country’s tourism experience.”
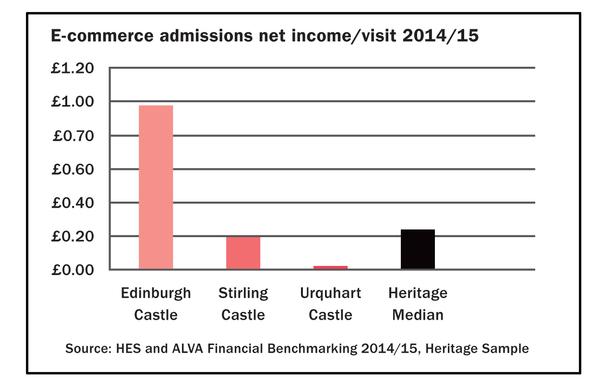
HES is now keen to understand the opportunity to grow online ticket sales. Edinburgh Castle is already outperforming the heritage sector median (see Figure 4). However a more detailed look at the findings indicates that Edinburgh Castle lies within the third quartile; in excess of 25 per cent of the heritage sample exceeds the Edinburgh Castle figure.
A contributing factor to this benchmark is obviously the admission price charged by each attraction. In order to increase understanding of online ticket sales, the 2015/16 Financial Survey will benchmark ticket sales as a proportion of total admissions at participating sites.
VISITOR MOTIVATIONS
Understanding an individual’s underlying motivations for visiting an attraction uncovers a whole host of opportunities. Firstly, it provides insight which can be used to inform the visit experience itself.
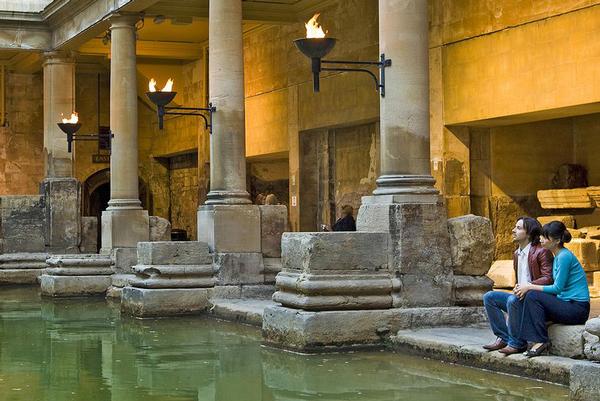
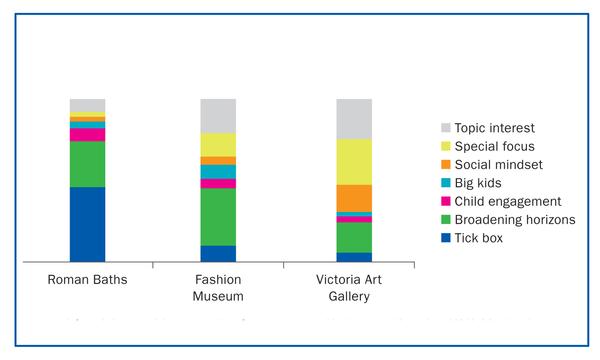
Pat Dunlop, commercial manager of the Roman Baths, Fashion Museum and Victoria Art Gallery (managed by Bath and North East Somerset Council) in Bath, has used this insight to good effect on the ground. Having introduced the ALVA Motivation Segments – just one aspect of the wider Visitor Benchmarking Survey – to the museums’ staff two years ago, Dunlop was able to summarise and benchmark the main reasons for people visiting these three sites in Bath (see Figure 5).
Pat fed back that “they made intuitive sense to us and were picked up immediately by the team. There was a huge difference in visitor motivations between our three sites, which really helped us to focus our thinking. We believed that the Fashion Museum catered for visitors with a passion for fashion, but the Visitor Experience Benchmark showed that a high proportion of visitors came to “broaden horizons”. This has been a revelation and has given the team confidence that they should think big and tell the ‘History of Fashion in 100 Objects’.”
Understanding the ALVA Motivation Segments has also identified some useful insights for the sector overall. For example, attractions cannot assume that everyone visiting with children is out for a child-centric visit. Those visiting with ‘Child Engagement’ motivations – driven by a desire for their children to learn, experience something new or simply to have fun – often only counts for a fraction of family visits overall. The visitor experience approach will need to be very different for attractions with a genuinely high level of ‘Child Engagement’ visitors from those with a high level of children but whose accompanying adults are visiting for non-child reasons.
Large, sector-wide studies such as the ALVA Visitor Experience Benchmark also enable us to develop a deeper understanding of the profile and behaviour of the Motivation Segments by pooling our knowledge of these across all participating attractions. This identifies further opportunities for attractions to tailor their visit experience and associated marketing and communications.
For example, we know that those arriving with a ‘Social Mindset’ motivation are much more likely to use onsite catering facilities, to visit retail areas and also to be more interested in membership.
EMERGING TRENDS
Operating these surveys for more than 20 years enables ALVA to identify emerging sector trends and use them to create opportunities. The explosion in the influence of peer reviews in the visitor attraction decision process is one example. Just two years ago, word of mouth influenced 18 per cent of visits. This has since increased to 27 per cent and has come at the expense of a decline in travel guides. Never before has it been so important to harness the power of peer reviews – face-to-face or via social media – and the most forward looking attractions are focusing significant resources in this direction.
LEARN FROM THE SURVEYS
Managed by Morisetti Associates, the Financial Survey covers 100 sites. The BDRC-managed Visitor Experience Survey is compiled from the feedback of 30,000 visitors a year across over 80 leading UK attractions. Both are available to ALVA members and non-members with at least 100,000 visits per annum.